How to start developing a bot and finishing in Business Intelligence
- Published on
- • 6 minutos
<b>Disclaimer: </b><span style="font-weight: 400;">This post is entirely based on data which was captured hour by hour, with all of
 the loss of information which is caused by doing so.
</span>
I had been wanting to develop something outside work for a while that had to do with bots. Since it was nothing more than a small experiment, I decided to choose Twitter as the platform which would bring my bot to life.
It’s possible to create a wide range of bots, but in this case I felt that creating a simple bot would be the best option. The functionality of the bot is to write tweets every hour about data of certain interest, not responding to mentions nor giving any additional thought to this, but that would write automatically.
The bot writes two tweets every hour.
Once the type of bot was chosen, the next step was deciding what message it was going to send: songs, recommendations, restaurants, flights…. I was thinking about various options, but I was always finishing int he same point: THE DATA. There are different types of data and different ways of getting them, but why not use “Open Data” for my bot?
I already had some experience with the open data from the Bilbao City Council, and after looking through the existing catalogue, I thought that the data that would best adjusted to my bot were the ones from BilbonBizi. BilbonBizi is a bike rental system form the Bilbao City Council.
A few years ago I designed an app for Pebble smartwatches which allows people to see the location and availability of public bikes in the city. Since I was already comfortable with the format, I felt this would be the best choice for my bot.
The data come from an open data catalogue from the Bilbao City Council.
To access the data, the council has an XML file with the data in real time each bike station. I already had the Twitter account, the data and the only thing I needed was to tell the bot what I wanted it to write and how often. After looking at the XML file in detail, I decided to create a general statistics bot, which is to say that it wrote two tweets per hour with the general data about the service at that time:
<span style="font-weight: 400;">[The data about bikes in circulation appears with a * given that it cannot be obtained. On
 account of that and basing my information on this article date in the beginning of the
 year, I’m taking into account that there are 250 available bikes in total. It’s possible that
 the number will be less.]
</span>
A PHP script and a programmed task in the server make the bot write the messages automatically.
How is this done, you ask? By creating a programmed task in the server which launches a script every hour (PHP in this case), translating the entire XML file, it creates the two messages and it publishes them in Twitter.
Once this bot is functioning, what do we obtain? A service status update from BilbonBizi every hour.
Twitter is good and direct, but once the tweet is written the information is lost or you are obliged to use its API to recover it. As a result I decided to modify the script in PHP so that in addition to being able to continue writing the tweets, it would be able to write ALL the data in the document every hour and by station.
Having all these data divided by hour allows us to see deficiencies the service has by using tools like Microsoft Excel.
After some days, I can see the file getting bigger in size, I continue to capture more and more data and what are the data good for?
They could be used for Business Intelligence in order to transform the data into information and the information into knowledge.
After having all the data divided into hours, we have the chance to see, for example, at what time and on what days or in which months bikes are used least, which areas have the most activity, in which stations they are most likely to be damaged, etc. On a practical level, these data serve to help take decisions in order to improve the service with real data without having to move your computer.
We also have to keep in mind that this “study” is based ONLY on the data captured from the XML; by crossing them with others, like for example the weather or the route used with the bike (they are not available), we would acquire more information, greater knowledge of the service we offer and the ability to take decisions more effective and efficient.
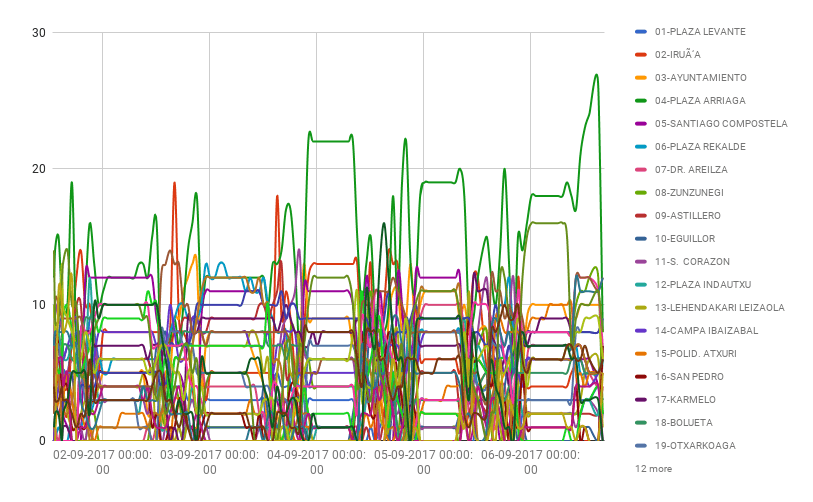
After capturing data for a few days, improvements (theoretical ones) to the service with some simple graphics.
So, after the time we have been capturing data every hour since the first of September, what have seen seen?
You can use any tool such as Microsoft Excel or Google Sheets to see the results. It isn´t necessary to go to paid applications like Tableau to be able to process data. Let’s look at some examples.
On the other hand, if We only show data from a station (Irala in this case), we can see that he was weekend without bicycles or at least during the week he moves in a gap of 0-6 bicycles. At first glance it is appreciated that more bicycles are needed at the weekend.
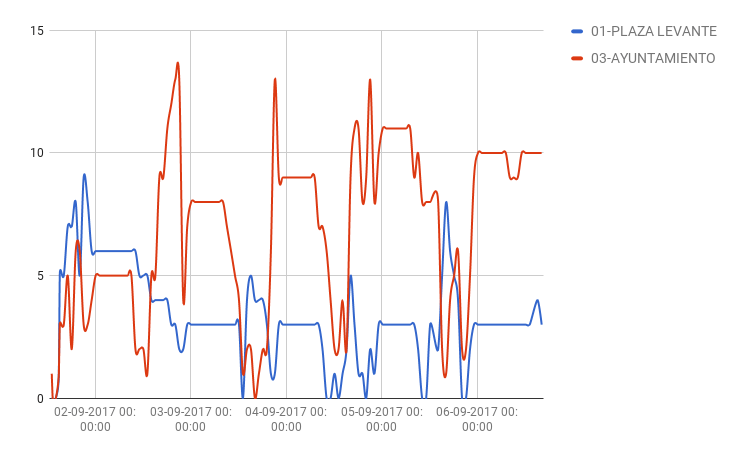
In this last graph of free bikes, It's the graph of Plaza Levante and the City Hall. In the City Hall in the afternoon the demand increases and the use of the service in the Plaza Levante during the week there are no more than 5 bicycles available.
As for broken bicycles, the numbers that the city does not offer are complicated to understand. In general there are few broken bikes but the numbers that offer the data tell us this.
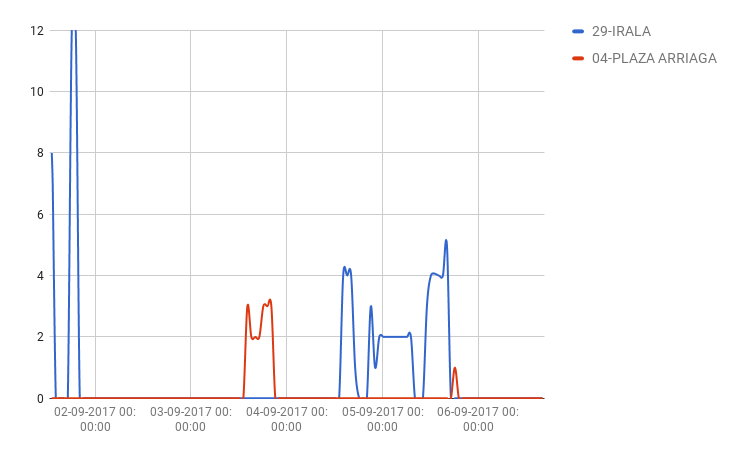
On the one hand we have the graph of Plaza Arriaga which is logical, small numbers of broken bicycles solved in hours. The strange case is the one of Irala that has numbers of 12 bicycles damaged and solved in an hour. Strange.
This is just a small sample of what can be done with open data, a bot and some technology.
Cheers.